Note
Click here to download the full example code
Vectors
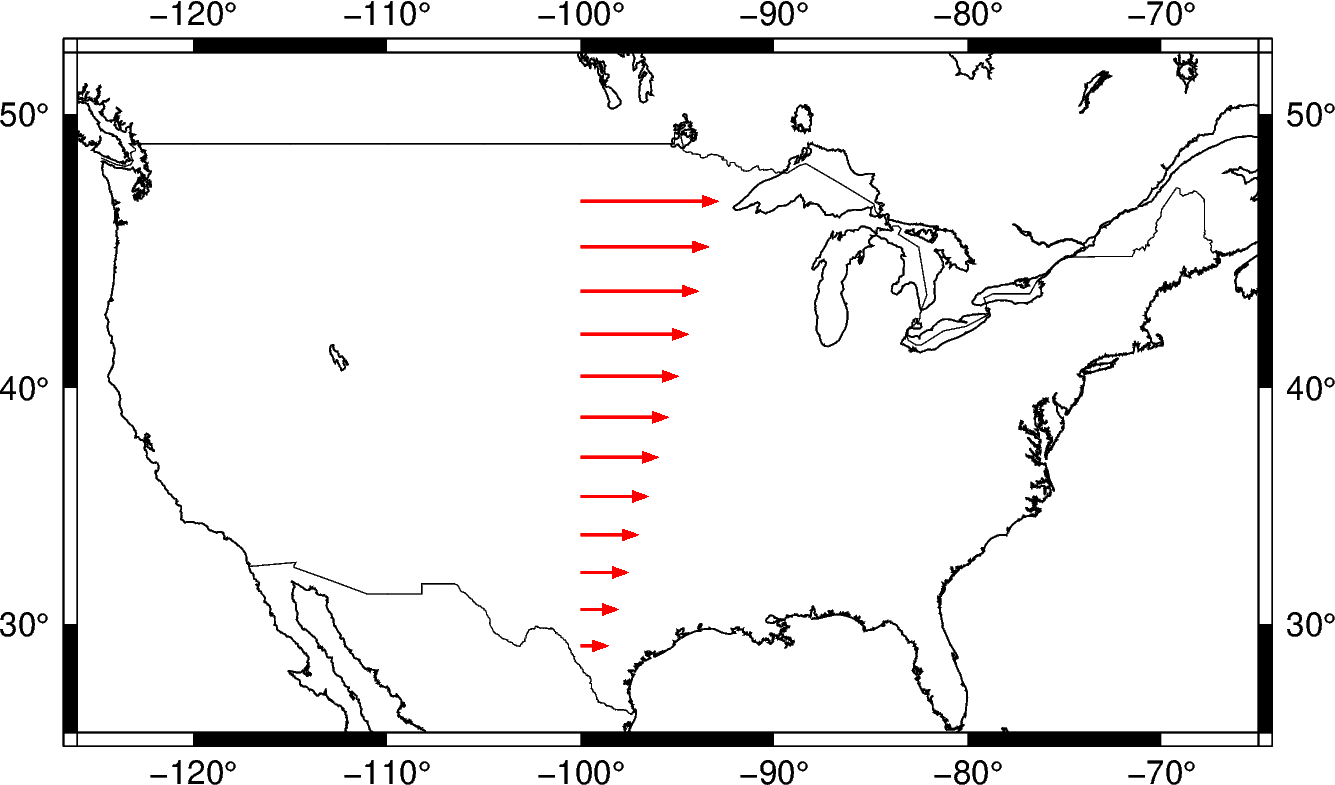
The pygmt.Figure.plot method can plot vectors without error ellipses.
The style parameter controls vector attributes as in GMT6

Out:
<IPython.core.display.Image object>
import numpy as np
import pygmt

# Generate a profile of points to plot
region = [-126, -65, 25, 52]
x = np.linspace(-100, -100, 12)  # x vector coordinates
y = np.linspace(29, 47, 12)  # y vector coordinates
xvec = np.linspace(1, 5, 12)  # dx vector data
yvec = np.zeros(np.shape(y))  # dy vector data

fig = pygmt.Figure()
# Create a 15x15 cm basemap with a Mercator projection (M) using the data region
fig.coast(region=region, projection="M15c", B="10.0", N="1", A="2000", W="0.5p,black")
# Plot vectors using:
# v0.2: vector size
# e: vector head at end
# a: 40 degree heads
# h0: head shape
# p: vector-head pen
# z: denotes vector's data in dx, dy (default is polar)
# direction: data arrays
fig.plot(
    x=x,
    y=y,
    style="v0.2+e+a40+gred+h0+p1p,red+z0.35",
    pen="1.0p,red",
    direction=[xvec, yvec],
)
fig.show()
Total running time of the script: ( 0 minutes 1.337 seconds)